Glossary
Thesis Glossary
A
Analysis of Variance (ANOVA)
Accelerated depreciation - is a depreciation method in which an asset loses book value at a faster (accelerated) rate than it would using traditional depreciation methods such as the straight-line method. The most popular accelerated depreciation methods are the double declining balance method and the sum of the years’ digits method.
An accounting method - refers to a set of rules that a company adheres to when keeping its financial records and reporting financial transactions. The transactions are recorded in a manner that accurately reflects true income.
An annual report - is a comprehensive report detailing a company’s activities throughout the preceding year. Its purpose is to provide users, such as shareholders or potential investors, with information about the company’s operations and financial performance (https://corporatefinanceinstitute.com/resources/knowledge/finance/annual-report/).
asset utilization ratios -
B
Balance Sheet - is one of the three fundamental financial statements and is key to both financial modeling and accounting. The balance sheet displays the company’s total assets, and how these assets are financed, through either debt or equity. It can also be referred to as a statement of net worth, or a statement of financial position. The balance sheet is based on the fundamental equation: Assets = Liabilities + Equity (https://corporatefinanceinstitute.com/resources/knowledge/accounting/balance-sheet/).
A budget year - also known as a Fiscal Year (FY), is a period of time used by the government and businesses for accounting purposes to formulate annual financial statements and reports. A fiscal year consists of 12-months or 52-weeks and might not end on December 31. A period which is set from January 1 to December 31 is called a calendar year (https://corporatefinanceinstitute.com/resources/knowledge/accounting/fy-fiscal-year/).
The Beta (β) of an investment security (i.e. a stock) is a measurement of its volatility of returns relative to the entire market. It is used as a measure of risk and is an integral part of the Capital Asset Pricing Model (CAPM). A company with a higher beta has greater risk and also greater expected returns (https://corporatefinanceinstitute.com/resources/knowledge/valuation/what-is-beta-guide/).
C
Cash Flow - is the increase or decrease in the amount of money a business, institution, or individual has. In finance, the term is used to describe the amount of cash (currency) that is generated or consumed in a given time period. Types of cash flow include: Cash from Operating Activities, Free Cash Flow to Equity, Free Cash Flow to the Firm, Net Change in Cash (https://corporatefinanceinstitute.com/resources/knowledge/finance/cash-flow/).
Causal research - allows causal inferences to be made; seeks to identify causea-nd-effect relationships (Zikmund, 2009, p.57).
The coefficient of variation (CV) - is a statistical measure of the dispersion of data points in a data series around the mean. The coefficient of variation represents the ratio of the standard deviation to the mean, and it is a useful statistic for comparing the degree of variation from one data series to another, even if the means are drastically different from one another (https://www.investopedia.com/terms/c/coefficientofvariation.asp).
Correlation matrix - is the standard form for reporting observed correlation coefficients among multiple variables (Zikmund, 2009, p.562).
A confidence interval - is an estimate of an interval in statistics that may contain a population parameter. The unknown population parameter is found through a sample parameter calculated from the sampled data. For example, the population mean is found using the sample mean x. The interval is generally defined by its lower and upper bounds. The confidence interval is expressed as a percentage (the most frequently quoted percentages are 90%, 95%, and 99%). The percentage reflects the confidence level (https://corporatefinanceinstitute.com/resources/knowledge/finance/confidence-interval/).
The Consumer Confidence Index (CCI) - is a survey that measures how optimistic or pessimistic consumers are regarding their expected financial situation (https://www.investopedia.com/terms/c/cci.asp).
Corporate finance - deals with the capital structure of a corporation, including its funding and the actions that management takes to increase the value of the company. Corporate finance also includes the tools and analysis utilized to prioritize and distribute financial resources. The ultimate purpose of corporate finance is to maximize the value of a business through planning and implementation of resources, while balancing risk and profitability. Corporate finance activities are: capital investments, capital financing, and dividends and return of capital (https://corporatefinanceinstitute.com/resources/knowledge/finance/corporate-finance-industry/).
Cost of Equity - is the rate of return a company pays out to equity investors. A firm uses cost of equity to assess the relative attractiveness of investments, including both internal projects and external acquisition opportunities. The cost of equity can be calculated by using the CAPM (Capital Asset Pricing Model) or Dividend Capitalization Model (for companies that pay out dividends).
The current P/E ratio - is the P/E ratio calculated using earnings per share expected by analysts during the current fiscal year.
Current Ratio (CR) (Block, Hirt, Danielsen, Short, & Perretta, 2012, p. 65) - is a liquidity ratio and examine current assets and current liabilities of the firm focusing on the need to meet cash requirements quickly. The formula used to determine the current ratio is
CR = (Current Assets) / (Current Liabilities)
Customer satisfaction - is the degree to which products or services provided by a company meet a customer’s expectations (https://corporatefinanceinstitute.com/resources/knowledge/other/measuring-customer-satisfaction/).
D
Data analysis - is the application of reasoning to understand the data that have been gathered (Zikmund, 2009, p.70).
Debt/Equity Ratio (D/E) (Block, Hirt, Danielsen, Short, & Perretta, 2012, p. 719) - is a calculation of capital structure of the firm: all liability to equity, debt obligations to equity, or long-term debt to equity. According to Ross, Westerfield, Jordan, & Roberts (2013, p. 64) the Debt/Equity ratio can be calculated as per formula
D/E = (Total Liabilities) / (Shareholders' Equity)
Debt maturity refers to the date the contract between issuers and investors ends (https://www.investopedia.com/terms/m/maturitydate.asp).
Descriptive research - describes characteristics of objects, people, groups, organizations, or environments; tries to “paint a picture” of a given situation (Zikmund, 2009, p.55).
Descriptive statistics - describe basic characteristics and summarize the data in a straightforward and understandable manner (Zikmund, 2009, p.413).
Dividend Payout Ratio (DPR) (Ross, Westerfield, Jordan, & Roberts, 2013, p. 90) - is the amount of cash paid out to shareholders divided by net income
DPR = (Dividends paid to shareholders) / (Net Income)
Dividends per Share (DPS) - represent the amount of the dividend that a shareholder will receive for each share they own. The term ‘Dividends’ signifies the payment declared by a company’s board of directors and given to its shareholders out of the company’s current or retained earnings, usually quarterly/yearly. Dividends include cash (cash dividend), stock (stock dividend), other property (S&P Capital. Market Intelligence, 2018).
Dividend signaling theory - is a theory that suggests that a company announcement of an increase in dividend payouts is an indication of positive future prospects (https://www.investopedia.com/terms/d/dividendsignaling.asp).
Dividend Yield (DY) (Block, Hirt, Danielsen, Short, & Perretta, 2012, p. 26) - represents the yield in immediate returns via dividends, and is calculated as per formula
DY = (Dividends per share) / (Market Share Price)
Dummy variables - The way a dichotomous (two group) independent variable is represented in regression analysis by assigning a 0 to one group and a 1 to the other (Zikmund, 2009, p.585).
E
Earnings Before Interest and Taxes (EBIT) -
Earnings (net income or loss) (Block, Hirt, Danielsen, Short, & Perretta, 2012, p.720) - represent the periodic value (not cash necessarily) available to shareholders after expenses are subtracted from revenues.
Earnings Growth - can be calculated based on Net Income value, which is similar to Afza & Tahir’s (2012, p. 336) and Dutta, Saha, & Das (2018, p. 169) approach, i.e. using the formula
Del(NI) = 100 x (NI(t) - NI(t-1)) / (NI(t-1))
Earnings per Share (EPS) (Block, Hirt, Danielsen, Short, & Perretta, 2012, p. 720) -represents the earnings available to common shareholders divided by the number of common stock shares outstanding.
EBITDA - stands for Earnings Before Interest, Taxes, Depreciation, and Amortization and is a metric used to evaluate a company’s operating performance.
Earnings volatility - is a statistical concept that determines the associated risk and helps predict the market price of a particular stock (https://corporatefinanceinstitute.com/resources/knowledge/finance/earnings-volatility/).
Economic conditions - are the present state of affairs in the overall economy of a country or geographical region. The conditions develop over time through various business and economic cycles (https://corporatefinanceinstitute.com/resources/knowledge/economics/economic-conditions/).
Emerging markets - is a term that refers to an economy that experiences considerable economic growth and possesses some, but not all, characteristics of a developed economy. Emerging markets are countries that are transitioning from the “developing” phase to the “developed” phase (https://corporatefinanceinstitute.com/resources/knowledge/economics/emerging-markets/).
An equity market - is a hub in which shares of companies are issued and traded. The market comes in the form of an exchange – which facilitates the trade between buyers and sellers – or over-the-counter (OTC) in which buyers and sellers find each other. The equity market is also referred to as the stock market and is one of the most important leading indicators of the market economy. (https://corporatefinanceinstitute.com/resources/knowledge/trading-investing/equity-market/).
Enterprise Value (EV) - is the measure of a company’s total value. It looks at the entire market value rather than just the equity value, so all ownership interests and asset claims from both debt and equity are included. EV can be thought of as the effective cost of buying a company or the theoretical price of a target company (before a takeover premium is considered). The simple formula for enterprise value is:
EV = Market Capitalization + Market Value of Debt – Cash and Equivalents
The extended formula is:
EV = Common Shares + Preferred Shares + Market Value of Debt +
+Minority Interest – Cash and Equivalents
(https://corporatefinanceinstitute.com/resources/knowledge/valuation/what-is-enterprise-value-ev/).
EV/Capital Employed Ratio - is a measure of enterprise value normalized by the level of capital used by the business. For example, a large business with a large capital stock is bound to realize a large enterprise value solely due to its large capital holdings. Formula used is:
EV/Capital Employed Ratio = EV / (Total Assets - Total Liabilities)
(https://corporatefinanceinstitute.com/resources/knowledge/valuation/ev-capital-employed-ratio/).
EV/EBITDA - is a ratio that compares a company’s Enterprise Value (EV) to its Earnings Before Interest, Taxes, Depreciation & Amortization (EBITDA). The EV/EBITDA ratio is commonly used as a valuation metric to compare the relative value of different businesses (https://corporatefinanceinstitute.com/resources/knowledge/valuation/ev-ebitda/).
The equity value (or net asset value) - is the value that remains for the shareholders after any debts have been paid off (https://corporatefinanceinstitute.com/resources/knowledge/valuation/enterprise-value-vs-equity-value/).
The Estimated P/E ratio (Forward P/E or leading P/E ratio) - P/E ratio based on earnings per share projected by analysts for the next fiscal year (see Chapter 11 in Bonham, Langdon, & Epstein, 2008).
F
Financial statements - Financial statements are written records that convey the business activities and the financial performance of a company. Financial statements are often audited by government agencies, accountants, firms, etc. to ensure accuracy and for tax, financing, or investing purposes (https://www.investopedia.com/terms/f/financial-statements.asp).
A Fiscal Year (FY) - also known as a budget year, is a period of time used by the government and businesses for accounting purposes to formulate annual financial statements and reports. A fiscal year consists of 12-months or 52-weeks and might not end on December 31. A period which is set from January 1 to December 31 is called a calendar year (https://corporatefinanceinstitute.com/resources/knowledge/accounting/fy-fiscal-year/).
Foreign exchange (Forex or FX) - is the conversion of one currency into another at a specific rate known as the foreign exchange rate.
Forced entry (or Enter as it is known in SPSS) - is a method in which all predictors are forced into the regression model simultaneously. This method relies on good theoretical reasons for including the chosen predictors, but unlike hierarchical the experimenter makes no decision about the order in which variables are entered (Field, 2009, p.212-213).
The SPSS predefined forward and backward options - are stepwise regression methods that decide about the order in which predictors are entered into the regression model, purely based on a mathematical criterion.
In the forward method, an initial model is defined that contains only the constant (b0). The computer then searches for the predictor (out of the ones available) that best predicts the outcome variable – it does this by selecting the predictor that has the highest simple correlation with the outcome. If this predictor significantly improves the ability of the model to predict the outcome, then this predictor is retained in the model and the computer searches for a second predictor. The criterion used for selecting this second predictor is that it is the variable that has the largest semi-partial correlation with the outcome. As such, this semi-partial correlation gives a measure of how much ‘new variance’ in the outcome can be explained by each remaining predictor (see section 6.6). The predictor that accounts for the most new variance is added to the model and, if it makes a significant contribution to the predictive power of the model, it is retained and another predictor is considered. The backward method is the opposite of the forward method in that the computer begins by placing all predictors in the model and then calculating the contribution of each one by looking at the significance value of the t-test for each predictor. This significance value is compared against a removal criterion (which can be either an absolute value of the test statistic or a probability value for that test statistic). If a predictor meets the removal criterion (i.e. if it is not making a statistically significant contribution to how well the model predicts the outcome variable) it is removed from the model and the model is re-estimated for the remaining predictors. The contribution of the remaining predictors is then reassessed (Field, 2009, p.212-213).
The Forward P/E ratio (leading P/E or estimated P/E ratio) - P/E ratio based on earnings per share projected by analysts for the next fiscal year (see Chapter 11 in Bonham, Langdon, & Epstein, 2008).
G
G7 - stands for “Group of Seven” industrialized nations. The group includes the United States, the United Kingdom, Germany, Canada, Japan, France and Italy (https://time.com/5657375/what-is-g7/).
Gallup poll - a series of questions asked of a group of people in order to find out what they think about a particular subject or how they will vote in an election (https://dictionary.cambridge.org/dictionary/english/gallup-poll).
Gross domestic product (GDP) - is a standard measure of a country’s economic health and an indicator of its standard of living. Also, GDP can be used to compare the productivity levels between different countries. Furthermore, GDP indicates economic expansion or compression and the growth or decline of an economy.
Growth rates - refer to the percentage change of a specific variable within a specific time period (https://www.investopedia.com/terms/g/growthrates.asp).
H
Historic P/E ratio (or Trailing P/E) – based on earnings per share over the past four quarters or 12 months of earnings. This number give us a view of a company’s earnings ratios based on accurate historical data (see Chapter 11 in Bonham, Langdon, & Epstein, 2008).
A Holding Company - is a company that doesn’t conduct any operations, ventures, or other active tasks for itself. Instead, it exists for the purpose of owning assets. In other words, the company does not engage in the buying and selling of any products and services. Instead, it was formed so that it gains control over one or more companies (https://corporatefinanceinstitute.com/resources/knowledge/strategy/holding-company/).
Hypotheses about differences between groups - examine how some variable varies from one group to another. These types of hypotheses are very common in causal designs (Zikmund, 2009, p.509).
Hypotheses about differences from some standard - examine how some variable differs from some preconceived standard. The preconceived standard sometimes represents the true value of the variable in a population. These tests can involve either a test of a mean for better-than ordinal variables or a test of frequencies if the variable is ordinal or nominal. These tests typify univariate statistical tests (Zikmund, 2009, p.509).
I
International Financial Reporting Standards (IFRS) -
Income Statement - is one of the three fundamental financial statements that shows company’s profit and loss over a period of time. The profit or loss is determined by taking all revenues and subtracting all expenses from both operating and non-operating activities (https://corporatefinanceinstitute.com/resources/knowledge/accounting/income-statement/).
Idiosyncratic effects - are factors unique to individual entities (Jordan, 2009, p.91). Such effects could be the announcement of a large contract, whether the directors have recently bought or sold shares, or how warmly the company is recommended by analysts (Anderson, 2005, p.2).
Inferential statistics - used to make inferences or to project from a sample to an entire population (Zikmund, 2009, p.413).
Inflation - is an economic concept that refers to increases in the price level of goods over a set period of time. The rise in the price level signifies that the currency in a given economy loses purchasing power (i.e., less can be bought with the same amount of money). Inflation is most commonly calculated by observing changes in price indices. Generally, changes in the Consumer Price Index (CPI) are used as a proxy for inflation (https://corporatefinanceinstitute.com/resources/knowledge/economics/inflation/).
An Interest rate - refers to the amount charged by a lender to a borrower for any form of debt given, generally expressed as a percentage of the principal (https://corporatefinanceinstitute.com/resources/knowledge/finance/interest-rate/).
International Financial Reporting Standards (IFRS) - set common rules so that financial statements can be consistent, transparent, and comparable around the world. IFRS are issued by the International Accounting Standards Board (IASB). They specify how companies must maintain and report their accounts, defining types of transactions, and other events with financial impact (https://www.investopedia.com/terms/i/ifrs.asp).
Interquartile range - the difference between the first and third quartile: Q3–Q1 (https://www.investopedia.com/terms/q/quartile.asp).
Inventory valuation refers to the practice of accounting for the value of a business’ inventory (https://corporatefinanceinstitute.com/resources/knowledge/accounting/inventory-valuation/).
Investment Portfolio - is a set of financial assets owned by an investor that may include bonds, stocks, currencies, cash and cash equivalents, and commodities (https://corporatefinanceinstitute.com/resources/knowledge/trading-investing/investment-portfolio/).
Investor sentiment - also known as market sentiment, refers to the general outlook or attitude of investors toward a particular security or the overall financial market. The optimism or pessimism of the market players is most evident in the overall price trends (https://corporatefinanceinstitute.com/resources/knowledge/trading-investing/market-sentiment/). In research, the following proxies are used for investment sentiment: consumer and business sentiment variables, the turnover ratio (or market liquidity).
J
K
Kurtosis - is a statistical measure that defines how heavily the tails of a distribution differ from the tails of a normal distribution. In other words, kurtosis identifies whether the tails of a given distribution contain extreme values.
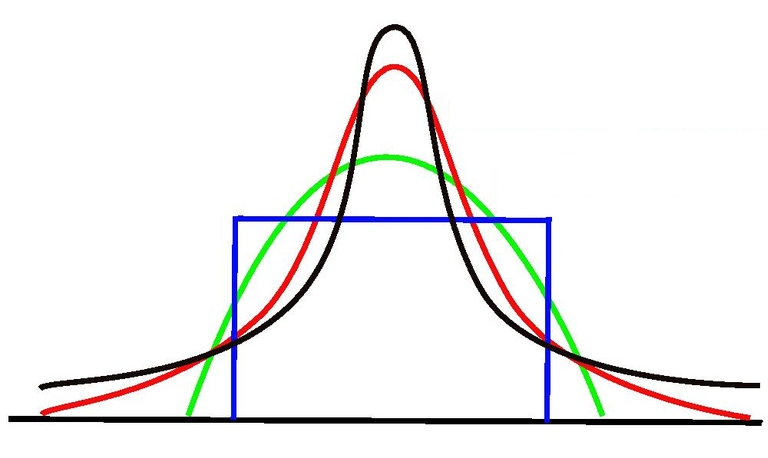
In finance, kurtosis is used as a measure of financial risk. A large kurtosis is associated with a high level of risk for an investment because it indicates that there are high probabilities of extremely large and extremely small returns. On the other hand, a small kurtosis signals a moderate level of risk because the probabilities of extreme returns are relatively low.
An excess kurtosis is a metric that compares the kurtosis of a distribution against the kurtosis of a normal distribution. The kurtosis of a normal distribution equals 3. Therefore, the excess kurtosis is found using the formula below:
Excess Kurtosis = Kurtosis – 3
(https://corporatefinanceinstitute.com/resources/knowledge/other/kurtosis/).
L
The First In First Out (LIFO) method - an inventory valuation method based on the First In First Out rule, i.e. the LIFO system is founded on the assumption that the last items on the shelf are the first items to be sold (https://corporatefinanceinstitute.com/resources/knowledge/accounting/lifo-vs-fifo/).
The Leading P/E ratio (Forward P/E or estimated P/E ratio) - P/E ratio based on earnings per share projected by analysts for the next fiscal year (see Chapter 11 in Bonham, Langdon, & Epstein, 2008).
Level of statistical significance (alpha) - the probability of making a Type I error (Zikmund, 2009, p.647).
A leverage ratio - is any kind of financial ratio that indicates the level of debt incurred by a business entity against several other accounts in its balance sheet, income statement, or cash flow statement. These ratios provide an indication of how the company’s assets and business operations are financed (using debt or equity). The common leverage ratios are: debt/equity, debt/capital, debt/assets, debt/EBITDA,(https://corporatefinanceinstitute.com/resources/knowledge/finance/leverage-ratios/).
Liquidity ratio - is a type of financial ratio used to determine a company’s ability to pay its short-term debt obligations. The metric helps determine if a company can use its current, or liquid, assets to cover its current liabilities. Three liquidity ratios are commonly used - the current ratio, quick ratio, and cash ratio (https://corporatefinanceinstitute.com/resources/knowledge/finance/liquidity-ratio/).
Logarithmic regression model - each variable of multiple regression model are logarithm on base 10 transformed.
Long-term investors represent people investing in long-term financial instruments that they hold for more than one year (https://corporatefinanceinstitute.com/resources/knowledge/trading-investing/short-term-vs-long-term-investors/).
M
A macroeconomic factor is a pattern, characteristic, or condition that emanates from, or relates to, a larger aspect of an economy rather than to a particular population. The characteristic may be a significant economic, environmental, or geopolitical event that widely influences a regional or national economy. Inflation, gross domestic product (GDP), national income, and unemployment levels are examples of macroeconomic factors.
Market capitalization (Market Cap) - is the most recent market value of a company’s outstanding shares. The Market Cap is equal to the current share price multiplied by the number of shares outstanding (https://corporatefinanceinstitute.com/resources/knowledge/finance/what-is-market-capitalization/).
Market price - refers to the amount of money for what an asset can be sold in a market. The market price of a given good is a point of convergence of the demand and supply for that good (https://corporatefinanceinstitute.com/resources/knowledge/valuation/market-price/).
Market return - the return on the overall theoretical market portfolio which includes all assets and having the portfolio weighted for value (http://www.businessdictionary.com/definition/market-return.html).
The mean - a measure of central tendency; the arithmetic average (Zikmund, 2009, p.415).
Median - a measure of central tendency that is the midpoint; the value below which half the values in a distribution fall (Zikmund, 2009, p.418).
Mode - a measure of central tendency; the value that occurs most often (Zikmund, 2009, p.418).
Model building - the use of secondary data to help specify relationships between two or more variables; can involve the development of descriptive or predictive equations (Zikmund, 2009, p.166).
Multiple regression analysis - an analysis of association in which the effects of two or more independent variables on a single, interval-scaled dependent variable are investigated simultaneously. (Zikmund, 2009, p.584).
N
Natural Log of Total Assets (ln(TA)) - is the logarithm to the base of Euler’s number e (𝑒 ≈ 2.71828) of Total Assets, i.e. ln(TA).
Net asset value per share (NAVPS) - indicates the value of a share which is calculated by subtracting total liabilities from total assets and dividing the result by the number of shares that exist (Dutta, 2018, p.169).
Net Profit Margin (NPM) (Larson & Jensen, Fundamental Accounting Principles, 2010 (2), p. 1014) - reflects a company’s ability to earn a net income from sales or revenue and gives an indication of how sensitive net income is to changes in either prices or costs. This ratio can be calculated in several ways, one of the formulas being
NPM = (Net Income) / (Total Revenue)
O
Ordinary least squares (OLS) method - is a relatively straightforward mathematical technique that guarantees that the resulting straight line will produce the least possible total error in using X to predict Y (Zikmund, 2009, p.569).
Ownership structure - business structure concerns the internal organization of a business entity and the rights and duties of the individuals holding a legal or equitable interest in that business. Canada’s business structure types: Sole proprietorship, Partnership (General, Limited), Corporation (Private, Public), and Cooperative (https://learn.marsdd.com/article/structuring-your-business-in-ontario-what-form-to-take/).
P
P-value - Probability value, or the observed or computed significance level; p-values are compared to significance levels to test hypotheses (Zikmund, 2009, p.510).
Percentage Change in quantity X (Del(X)) - is calculated as per formula
Del(X) = 100 x (X(t)-X(t-1)) / X(t-1)
where X(t) is the value of 𝑋 for year t, and X(t-1) is the value of 𝑋 for year (t-1).
Price to Book Ratio (P/B ratio) - also called Market to Book ratio, is a financial valuation metric used to evaluate a company’s current market value relative to its book value. The market value is the current stock price of all outstanding shares (i.e. the price that the market believes the company is worth). The book value is the amount that would be left if the company liquidated all of its assets and repaid all of its liabilities (https://corporatefinanceinstitute.com/resources/knowledge/valuation/market-to-book-ratio-price-book/).
Price to Earnings Ratio (P/E ratio) (Block, Hirt, Danielsen, Short, & Perretta, 2012, pp. 25, 308) - represents a multiplier applied to earnings per share and current market value. The P/E ratio is calculated as per formula
P/E ratio = (Market Share Price) / (Earnings per Share)
P/E effect – a phenomenon when better investment performance can be obtained from a portfolio comprised of low P/E ratio stocks in contrast to portfolios made up of high P/E ratio stocks (Ikoku, Hosseini, & Okany, 2010, p. 6584).
Price to Sales ratio (P/S ratio) – is a formula used to measure the total value that investors place on the company in comparison to the total revenue generated by the business. It is calculated by dividing the share price by the sales per share (https://corporatefinanceinstitute.com/resources/knowledge/valuation/price-to-sales-ratio/).
Price-to-Cash Flow ratio (P/CF ratio) - is a financial multiple that compares a company’s market value to its operating cash flow (or the company’s stock price per share to its operating cash flow per share) (https://corporatefinanceinstitute.com/resources/knowledge/finance/price-to-cash-flow-ratio/).
Probability sampling - every element in the population has a known, nonzero probability of selection (Zikmund, 2009, p.395).
Profitability ratios - are financial metrics used by analysts and investors to measure and evaluate the ability of a company to generate income (profit) relative to revenue, balance sheet assets, operating costs, and shareholders’ equity during a specific period of time. They show how well a company utilizes its assets to produce profit and value to shareholders. All profitability ratios can be generalized into two categories: Margin Ratios (Gross Profit, EBITDA, Operating Profit, Net Profit, Cash Flow) and Return Ratios (ROA, ROE, Return on Invested Capital) (https://corporatefinanceinstitute.com/resources/knowledge/finance/profitability-ratios/).
Public companies - are entities that trade their stocks on the public exchange market (https://corporatefinanceinstitute.com/resources/knowledge/finance/public-companies/).
Q
Quantitative business research - Business research that addresses research objectives through empirical assessments that involve numerical measurement and analysis (Zikmund, 2009, p.657).
Quantitative data - Data that represent phenomena by assigning numbers in an ordered and meaningful way (Zikmund, 2009, p.657).
Quick Ratio (QR) (Ross, Westerfield, Jordan, & Roberts, 2013, p. 63) - is another way to evaluate liquidity, and is computed just like the current ratio, except inventory is omitted, since inventory is often the least liquid current asset. The formula for quick ratio is
QR = (Current Assets - Inventory) / (Current Liabilities)
The Q Ratio, or Tobin’s Q Ratio, is a ratio between a physical asset’s market value and its replacement value. The ratio was developed by James Tobin, a Nobel laureate in economics. Tobin suggested a hypothesis that the combined market value of all companies on the stock market should be about equal to their replacement costs. The ratio can be used for valuing a single company and even the whole stock market. The original formula for the Q Ratio is:
Q Ratio = (Market value of assets) / (Replacement cost of capital)
However, in real life, it is very difficult to estimate the replacement costs of total assets. Thus, there is a modification of the original formula, in which the replacement costs of the assets are replaced with their book values.
Q Ratio = (Equity market value + Liabilities’ market value) / (Equity book value + Liabilities’ market value)
The Q Ratio can be calculated for the overall market:
Q Ratio = (Value of stock market) / (Corporate net worth)
(https://corporatefinanceinstitute.com/resources/knowledge/valuation/q-ratio/).
R
The range - It is the distance between the smallest and the largest values of a frequency distribution (Zikmund, 2009, p.418).
Raw data - The unedited responses from a respondent exactly as indicated by that respondent (Zikmund, 2009, p.462).
Regression analysis - is a technique for measuring the linear association between a dependent and an independent variable (Zikmund, 2009, p.564).
Relational hypotheses - examine how changes in one variable vary with changes in another. This is usually tested by assessing covariance in some way, very often with regression analysis (Zikmund, 2009, p.509).
Research design - a master plan that specifies the methods and procedures for collecting and analyzing the needed information (Zikmund, 2009, p.657).
Return on Assets (ROA) (Ross, Westerfield, Jordan, & Roberts, 2013, p. 68) - is a measure of profit per dollar of assets. It can be defined in several ways, but the most common is:
ROA = (Net Income) / (Total Assets)
Return on Equity (ROE) (Ross, Westerfield, Jordan, & Roberts, 2013, p. 68) - is a measure of how the shareholders fared during the year. ROE is, in accounting sense, the true bottom-line measure of performance. ROE is usually measured as:
ROE = (Net Income) / (Shareholders' Equity)
Return on Investment (ROI) (Block, Hirt, Danielsen, Short, & Perretta, 2012, p. 60) - measures the firm’s overall efficiency in the use of capital. For the calculation of this ratio, the following formulas was used
ROI = (EBIT) / (Total Assets)
Risk - In finance, risk is the probability that actual results will differ from expected results. In the Capital Asset Pricing Model (CAPM), risk is defined as the volatility of returns.
S
A sample bias - exists when the results of a sample show a persistent tendency to deviate in one direction from the true value of the population parameter (Zikmund, 2009, p.189).
A Sampling frame - A list of elements from which a sample may be drawn, also called working population. (Zikmund, 2009, p.391).
Secondary data - data that have been previously collected for some purpose other than the one at hand (Zikmund, 2009, p.161).
Short-term investors are investors who invest in financial instruments intended to be held in an investment portfolio for less than one fiscal year (https://corporatefinanceinstitute.com/resources/knowledge/trading-investing/short-term-vs-long-term-investors/).
Significance level - A critical probability associated with a statistical hypothesis test that indicates how likely an inference supporting a difference between an observed value
and some statistical expectation is true. The acceptable level of Type I error (Zikmund, 2009, p.510).
Simple (bivariate) linear regression - a measure of linear association that investigates a straight-line relationships between a continuous dependent variable and an independent variable that is usually continuous, but can be a categorical dummy variable (Zikmund, 2009, p.564).
Simple random sampling - A sampling procedure that assures each element in the population of an equal chance of being included in the sample (Zikmund, 2009, p.398).
Skewness - is a measure of asymmetry or distortion of symmetric distribution. It measures the deviation of the given distribution of a random variable from a symmetric distribution, such as normal distribution. A normal distribution is without any skewness, as it is symmetrical on both sides. Hence, a curve is regarded as skewed if it is shifted towards the right or the left
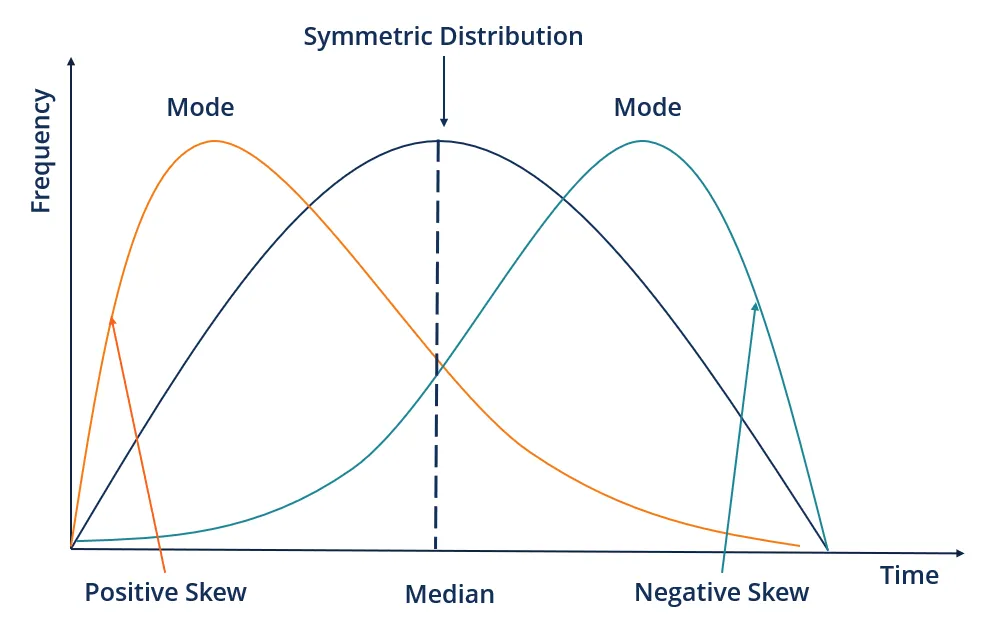
If the given distribution is shifted to the left and with its tail on the right side, it is a positively skewed distribution. It is also called the right-skewed distribution. Since the skewness of the given distribution is on the right, the mean value is greater than the median and moves towards the right, and the mode occurs at the highest frequency of the distribution.
If the given distribution is shifted to the right and with its tail on the left side, it is a negatively skewed distribution. It is also called a left-skewed distribution. The skewness of the given distribution is on the left; hence, the mean value is less than the median and moves towards the left, and the mode occurs at the highest frequency of the distribution.
Skewness can be measured using several methods:
Skewness = (M-Mo) / s or Skewness = (3M-Me) / s
(https://corporatefinanceinstitute.com/resources/knowledge/other/skewness/).
Standard deviation - A quantitative index of a distribution’s spread, or variability; the square root of the variance for a distribution (Zikmund, 2009, p.420).
Standard error - is a mathematical tool used in statistics to measure variability. It enables one to arrive at an estimation of what the standard deviation of a given sample is. It is commonly known by its abbreviated form – SE. SE is used to estimate the efficiency, accuracy, and consistency of a sample. In other words, it measures how precisely a sampling distribution represents a population. Standard error of the mean is calculated using the formula:
SEM = sigma / sqrt(n) or SEM = s / sqrt(n)
(https://corporatefinanceinstitute.com/resources/knowledge/other/standard-error/).
Standard error of mean (SEM) - measures how far the sample mean of the data is likely to be from the true population mean (https://www.investopedia.com/ask/answers/042415/what-difference-between-standard-error-means-and-standard-deviation.asp).
Stock analysis - is the evaluation of a particular trading instrument, an investment sector, or the market as a whole (www.investopedia.com).
Stock Markets - are where individual and institutional investors come together to buy and sell shares in a public venue (www.investopedia.com).
Stock valuation - is a method of determining the intrinsic value (or theoretical value) of a stock (https://corporatefinanceinstitute.com/resources/knowledge/trading-investing/stock-valuation/).
T
The target population - is the total population for which the information is required (https://www150.statcan.gc.ca/n1/edu/power-pouvoir/ch13/sample-echantillon/5214900-eng.htm).
The Tobin's Q Ratio (or Q Ratio) - is a ratio between a physical asset’s market value and its replacement value. The ratio was developed by James Tobin, a Nobel laureate in economics. Tobin suggested a hypothesis that the combined market value of all companies on the stock market should be about equal to their replacement costs. The ratio can be used for valuing a single company and even the whole stock market. The original formula for the Q Ratio is:
Q Ratio = (Market value of assets) / (Replacement cost of capital)
However, in real life, it is very difficult to estimate the replacement costs of total assets. Thus, there is a modification of the original formula, in which the replacement costs of the assets are replaced with their book values.
Q Ratio = (Equity market value + Liabilities’ market value) / (Equity book value + Liabilities’ market value)
The Q Ratio can be calculated for the overall market:
Q Ratio = (Value of stock market) / (Corporate net worth)
(https://corporatefinanceinstitute.com/resources/knowledge/valuation/q-ratio/).
Total Asset Turnover (TAT) (Larson & Jensen, Fundamental Accounting Principles, 2010 (2), p. 1010) - describes the ability of a company to use its assets to generate sales or revenue. This ratio is calculated as
TAT = (Total Revenue) / (Total Assets)
Total shareholder return (TSR) - is the financial gain that results from a change in the stock's price plus any dividends paid by the company during the measured interval divided by the initial purchase price of the stock (https://www.investopedia.com/terms/t/tsr.asp).
Trailing P/E ratio (or historic P/E) – based on earnings per share over the past four quarters or 12 months of earnings. This number give us a view of a company’s earnings ratios based on accurate historical data (see Chapter 11 in Bonham, Langdon, & Epstein, 2008).
5% trimmed mean - similar to an adjusted mean, is a method of averaging that removes 5% of the largest and smallest values before calculating the mean (https://www.investopedia.com/terms/t/trimmed_mean.asp).
U
V
Value Premium - the difference in returns between high book-to-market stocks and low book-to-market stocks, a component of the Fama-French three-factor model (www.investopedia.com).
Variability - is a term used to describe how much data points in any statistical distribution differ from each other and from their mean value. The statistical tools used to measure variability are range, standard deviation, and variance (https://corporatefinanceinstitute.com/resources/knowledge/other/variability/).
Variance - a measure of variability or dispersion (Zikmund, 2009, p.420).
Variance Inflation Factor (VIF) -
Volatility - is a statistical tool that is used for measuring the dispersion of returns realized by an investor for a particular security index. Volatility is determined either by using the standard deviation or beta. Standard deviation measures the amount of dispersion in a security’s prices. Beta determines a security’s volatility relative to that of the overall market. Beta can be calculated using regression analysis (https://corporatefinanceinstitute.com/resources/knowledge/trading-investing/volatility-ratio/).
W
X
Y
Z